scaler normalization#
The use of StandardScaler in the context of kernel-based regression (e.g., SVM regression or Gaussian process regression) is a crucial preprocessing step.
This scaler normalizes each feature in the input data (mX) to have zero mean and unit variance.
This normalization is important because kernel-based methods are sensitive to the scale of the input data, as the kernels compute distances between data points.
If features are not scaled properly, features with larger scales will dominate the distance calculations, potentially leading to suboptimal performance of the model.
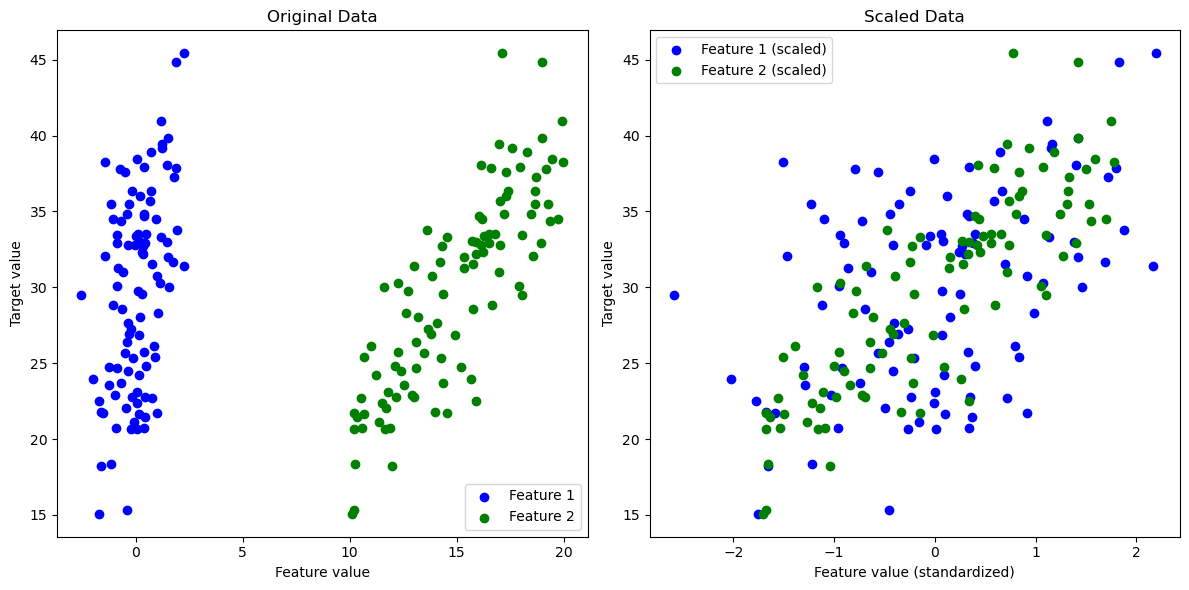
practical impact of feature scaling:#
import numpy as np
import matplotlib.pyplot as plt
from sklearn.preprocessing import StandardScaler

# Generate synthetic data with different scales and distributions
np.random.seed(0)
X1 = np.random.normal(0, 1, 100)  # Normally distributed data
X2 = np.random.uniform(10, 20, 100)  # Uniformly distributed data with a different scale
X = np.column_stack((X1, X2))
y = X1 * 3 + X2 * 2 + np.random.normal(0, 2, 100)  # Target variable with some noise

# Apply StandardScaler
scaler = StandardScaler()
X_scaled = scaler.fit_transform(X)

# Plotting the original and scaled data
plt.figure(figsize=(12, 6))

# Plot original data
plt.subplot(1, 2, 1)
plt.scatter(X[:, 0], y, color='blue', label='Feature 1')
plt.scatter(X[:, 1], y, color='green', label='Feature 2')
plt.title('Original Data')
plt.xlabel('Feature value')
plt.ylabel('Target value')
plt.legend()

# Plot scaled data
plt.subplot(1, 2, 2)
plt.scatter(X_scaled[:, 0], y, color='blue', label='Feature 1 (scaled)')
plt.scatter(X_scaled[:, 1], y, color='green', label='Feature 2 (scaled)')
plt.title('Scaled Data')
plt.xlabel('Feature value (standardized)')
plt.ylabel('Target value')
plt.legend()

plt.tight_layout()
plt.show()