Time Series#
Anomaly Detection in Time Series#
Anomaly detection in time series data can be more complex due to the temporal dependencies and potential seasonality or trends within the data. Various methods can be used, but some of the most effective ones include:
Z-Score in Rolling Window:
Description: Similar to the z-score for static data, but applied over a rolling window to account for changes over time.
Use Case: Useful for detecting sudden changes in data values compared to their recent history.
Moving Average and Exponential Smoothing:
Description: These methods smooth the data to highlight trends and deviations. Anomalies can be detected when data points deviate significantly from the smoothed values.
Use Case: Common in financial data and other applications where trends and seasonality are present.
ARIMA (AutoRegressive Integrated Moving Average):
Description: A popular model for forecasting time series data. Anomalies can be identified when the actual values significantly differ from the predicted values.
Use Case: Suitable for datasets with trends and seasonality.
Seasonal Decomposition of Time Series (STL):
Description: Decomposes a time series into seasonal, trend, and residual components. Anomalies can be detected in the residual component.
Use Case: Effective for datasets with clear seasonality.
Machine Learning Methods (e.g., LSTM, Autoencoders):
Description: These methods learn complex patterns and dependencies in the data. Anomalies are detected based on deviations from learned patterns.
Use Case: Suitable for complex time series data where traditional statistical methods may fall short.
Z-Score in Rolling Window#
For simplicity, let’s focus on using the z-score method with a rolling window.
General Overview:
A rolling window approach recalculates the mean and standard deviation within a window that moves across the time series.
The z-score is then computed for each data point within the context of its window.
Steps:
Define a window size (e.g., 30 days).
Calculate the rolling mean and rolling standard deviation for the defined window.
Compute the z-score for each data point within its respective window.
Identify anomalies based on a threshold (e.g., \(|z| > 3\)).
Example:
Let’s consider a time series dataset representing daily temperature readings:
We can apply a rolling window of 7 days:
Calculate Rolling Mean and Standard Deviation:
Compute Z-Scores:
For the 8th day (value 26):
Continue this process for the entire time series.
Identify Anomalies:
Flag data points where \(|z| > 3\). If any, these points would be considered anomalies.
Summary#
For time series data, the choice of method for anomaly detection depends on the nature of the data. A rolling z-score method is simple and effective for data with less complexity and no strong seasonal trends. For more complex data, methods like ARIMA, STL, or machine learning-based approaches like LSTM and autoencoders might be more appropriate. Each method has its strengths and should be chosen based on the specific characteristics and requirements of the dataset.
example in time series#
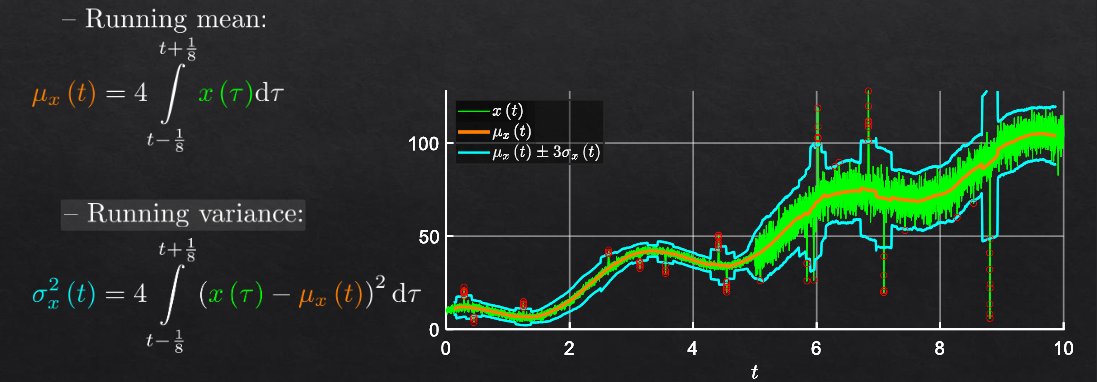
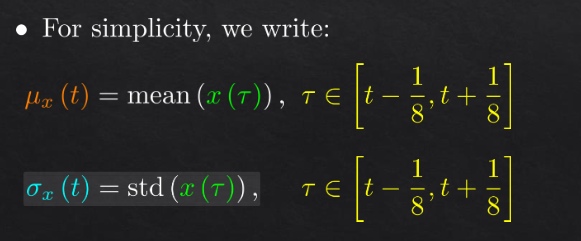
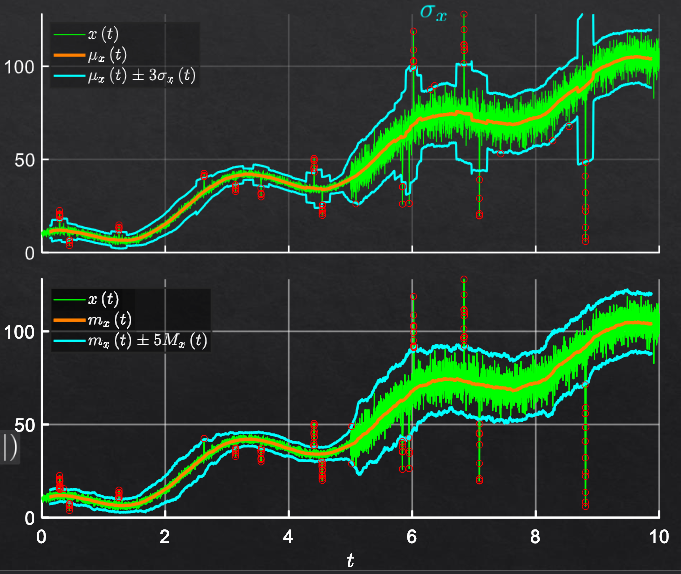
it time series mu and sigma are changing over time - the signal is not stationary
it is better to work with running windows