zscore#
Z-Score Method for Anomaly Detection#
General Overview#
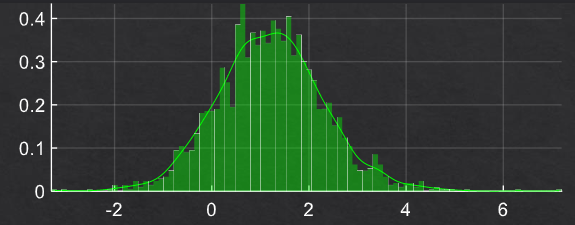
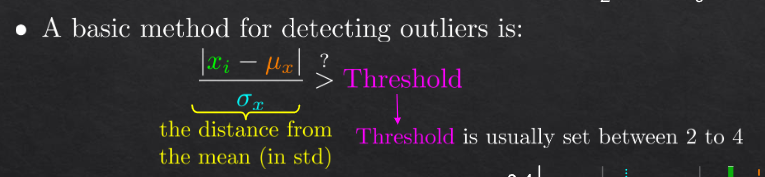
Anomaly detection involves identifying unusual patterns that do not conform to expected behavior. In the context of statistical analysis, a commonly used method for detecting outliers is the z-score. The z-score indicates how many standard deviations an element is from the mean of the dataset.
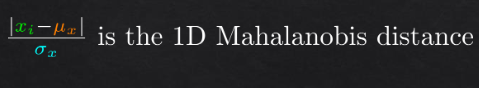
The z-score is calculated using the formula:
where:
\( X \) is the value of the data point,
\( \mu \) is the mean of the dataset,
\( \sigma \) is the standard deviation of the dataset.
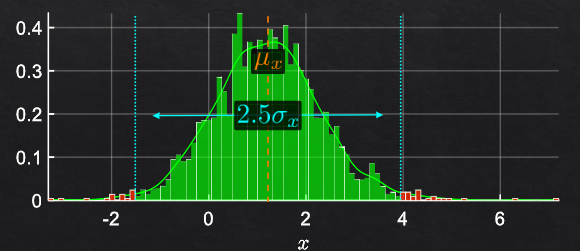
A data point is considered an outlier if its z-score is significantly higher or lower than the rest of the data points, typically beyond a threshold (e.g., \(|z| > 3\)).
Real-World Examples#
Financial Fraud Detection: In finance, unusual transaction amounts can be detected using z-scores. For instance, if most transactions are around \(100, a transaction of \)10,000 would have a high z-score, indicating potential fraud.
Network Security: In cybersecurity, z-scores can help identify abnormal network traffic patterns, such as a sudden spike in data transfer rates, which might indicate a cyber attack.
Healthcare: In medical data analysis, z-scores can highlight abnormal test results. For example, a blood test result far outside the normal range could indicate a health issue that requires further investigation.
Example Calculation#
Consider a dataset of daily sales figures for a retail store over a month:
Calculate the mean (\(\mu\)):
Calculate the standard deviation (\(\sigma\)):
Calculate the z-score for a specific data point, say 500:
Since the z-score of 500 is greater than 3, it can be considered an outlier in this dataset.
By setting a threshold (e.g., \(|z| > 3\)), we can systematically identify outliers and anomalies in the data.
Summary#
The z-score method is a straightforward and effective way to detect anomalies by measuring how far a data point deviates from the mean in terms of standard deviations. This method is widely used in various fields such as finance, cybersecurity, and healthcare to identify unusual patterns and potential issues that require further investigation.
example:#
calc for guassian distribution with noise , for input data: