manifold concepts demo#
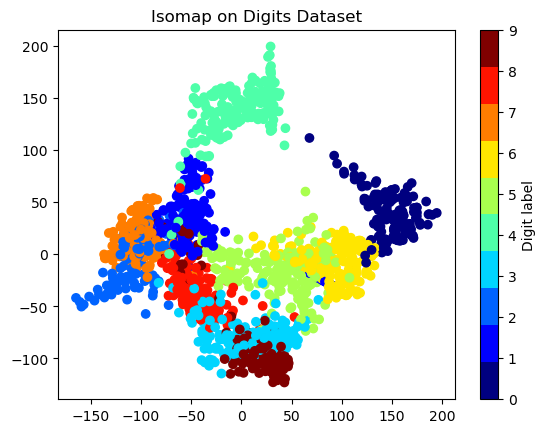
Isomap#
visualize complex datasets
from sklearn.manifold import Isomap
from sklearn.datasets import load_digits
import matplotlib.pyplot as plt

# Load the digits dataset
digits = load_digits()
X = digits.data  # The features

# Applying Isomap
iso = Isomap(n_neighbors=5, n_components=2)
X_iso = iso.fit_transform(X)

# Visualize the results
plt.scatter(X_iso[:, 0], X_iso[:, 1], c=digits.target, cmap=plt.cm.get_cmap('jet', 10))
plt.colorbar(label='Digit label')
plt.title('Isomap on Digits Dataset')
plt.show()
/data/solai/venvMamabaFixel/lib/python3.11/site-packages/sklearn/manifold/_isomap.py:383: UserWarning: The number of connected components of the neighbors graph is 2 > 1. Completing the graph to fit Isomap might be slow. Increase the number of neighbors to avoid this issue.
  self._fit_transform(X)
/data/solai/venvMamabaFixel/lib/python3.11/site-packages/scipy/sparse/_index.py:102: SparseEfficiencyWarning: Changing the sparsity structure of a csr_matrix is expensive. lil_matrix is more efficient.
  self._set_intXint(row, col, x.flat[0])
/tmp/ipykernel_2789554/2412619564.py:14: MatplotlibDeprecationWarning: The get_cmap function was deprecated in Matplotlib 3.7 and will be removed two minor releases later. Use ``matplotlib.colormaps[name]`` or ``matplotlib.colormaps.get_cmap(obj)`` instead.
  plt.scatter(X_iso[:, 0], X_iso[:, 1], c=digits.target, cmap=plt.cm.get_cmap('jet', 10))
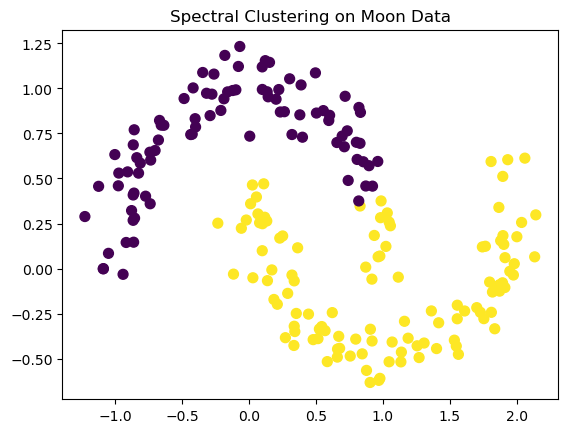
Spectral Clustering#
Cluster data that forms complex shapes.
from sklearn.datasets import make_moons
from sklearn.cluster import SpectralClustering
import matplotlib.pyplot as plt

X, y = make_moons(n_samples=200, noise=0.1, random_state=42)

# Apply Spectral Clustering
sc = SpectralClustering(n_clusters=2, affinity='nearest_neighbors')
labels = sc.fit_predict(X)

# Plot the results
plt.scatter(X[:, 0], X[:, 1], c=labels, s=50, cmap='viridis')
plt.title('Spectral Clustering on Moon Data')
plt.show()
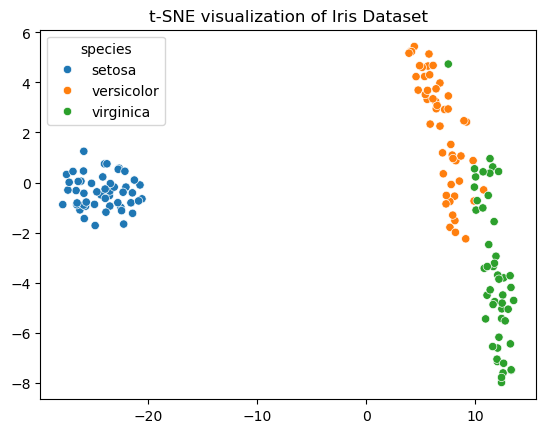
t-SNE#
Visualize high-dimensional data in one or two dimensions.
from sklearn.manifold import TSNE
import seaborn as sns
import matplotlib.pyplot as plt

data = sns.load_dataset('iris')
X = data.drop('species', axis=1)
y = data['species']

tsne = TSNE(n_components=2, random_state=42)
X_tsne = tsne.fit_transform(X)

sns.scatterplot(x=X_tsne[:,0], y=X_tsne[:,1], hue=y)
plt.title('t-SNE visualization of Iris Dataset')
plt.show()
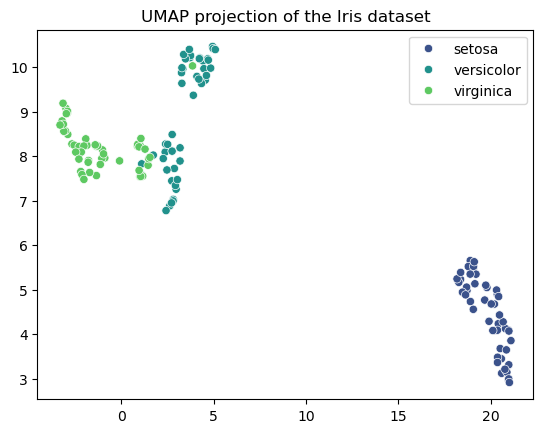
umap#
using the Iris dataset visualize the effectiveness of UMAP in projecting four-dimensional data into two dimensions while preserving the overall structure of the data.
import umap
import seaborn as sns
import matplotlib.pyplot as plt
from sklearn.datasets import load_iris

# Load Iris dataset
data = load_iris()
X = data.data
y = data.target

# Apply UMAP
reducer = umap.UMAP(n_neighbors=15, n_components=2, min_dist=0.1, random_state=42)
X_umap = reducer.fit_transform(X)

# Visualizing the result
sns.scatterplot(x=X_umap[:, 0], y=X_umap[:, 1], hue=data.target_names[y], palette='viridis')
plt.title('UMAP projection of the Iris dataset')
plt.show()
2024-05-08 07:25:30.671547: I tensorflow/core/platform/cpu_feature_guard.cc:182] This TensorFlow binary is optimized to use available CPU instructions in performance-critical operations.
To enable the following instructions: SSE4.1 SSE4.2 AVX AVX2 AVX512F AVX512_VNNI FMA, in other operations, rebuild TensorFlow with the appropriate compiler flags.
/data/solai/venvMamabaFixel/lib/python3.11/site-packages/umap/umap_.py:1943: UserWarning: n_jobs value -1 overridden to 1 by setting random_state. Use no seed for parallelism.
  warn(f"n_jobs value {self.n_jobs} overridden to 1 by setting random_state. Use no seed for parallelism.")